There were two events recently that made me quite concerned.
First, I was looking through some of the results from the Dromaeo test suite and I noticed a bunch of zero millisecond times being returned from tests. This was quite odd since the tests should’ve taken, at least, a couple milliseconds to run and getting consistent times of “0” is rather infeasible, especially for non-trivial code.
Second, I was running some performance tests, on Internet Explorer, in the SlickSpeed selector test suite and noticed the result times drastically fluctuating. When trying to figure out if changes that you’ve made are beneficial, or not, it’s incredibly difficult to have the times constantly shifting by 15 – 60ms every page reload.
Both of these cases set me out to do some investigating. All JavaScript performance-measuring tools utilize something like this to measure their results:
var start = (new Date).getTime();
/* Run a test. */
var diff = (new Date).getTime() - start;
The exact syntax differs but the crux of the matter is that they’re querying the Date object for the current time, in milliseconds, and finding the difference to get to total run time of the test.
There are a lot of extenuating circumstances that take place every time a piece of code is run. There could be other things running in another thread, maybe another process is consuming more resources – whatever it is it’s possible that the total run time of a test could fluctuate. How much that test fluctuates is largely consistent, following somewhere along a normal distribution:
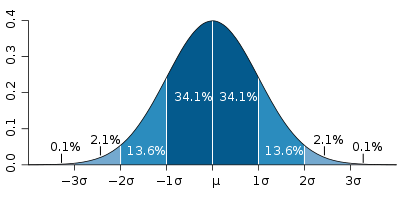
(Performance test suites like SunSpider and Dromaeo use a T-distribution to get a better picture of the distribution of the test times.)
To better understand the results I was getting I built a little tool that runs a number of tests: Running an empty function, looping 10,000 times, querying and looping over a couple thousand divs, and finally looping over and modifying those divs. I ran all of these tests back-t0-back and constructed a histogram of the results.
Here’s what the results look like for the major browsers on OS X:
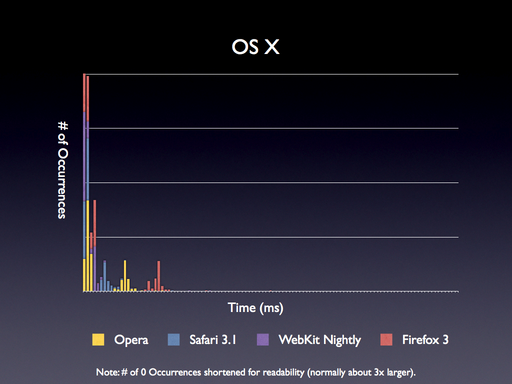
The results here are terrific: There’s some clumping around 0ms (with some results spread to 1-4ms – which is to be expected) and a bunch of normal-looking distributions for each of the browsers at around 7ms, 13ms, and 22ms. This is exactly what we should expect, nothing out of the ordinary taking place.
I then fired up VMware Fusion to peek at the browsers running in Windows XP:
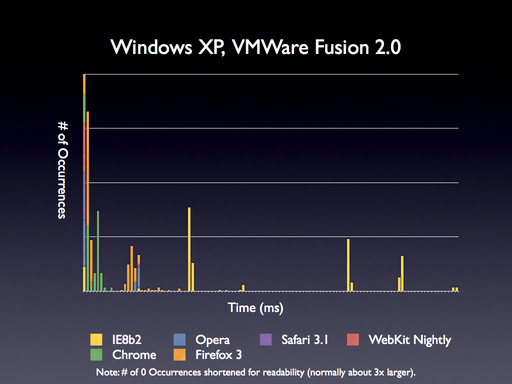
Huh. The results are much stranger here. There aren’t any, immediately, pretty clumps of results. It looks like Firefox 3 and Chrome both have a nice distribution tucked in there amongst the other results, but it isn’t completely obvious. What would happen if we removed those two browsers to see what the distribution looked like?
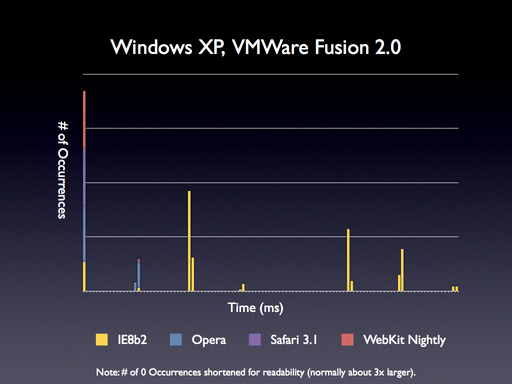
Wow. And there it is! Internet Explorer 8 (I also tested 6, for good measure, with the same results), Opera, Safari, and WebKit Nightly all bin their results. There is no ‘normal distribution’ whatsoever. Effectively these browsers are only updating their internal getTime representations every 15 milliseconds. This means that if you attempt to query for an updated time it’ll always be rounded down to the last time the timer was updated (which, on average, will have been about 7.5 milliseconds ago).
I was worried that these results were from the virtual machine (I also loaded up Parallels but saw similar results to running VMware) so I just loaded Windows XP proper:
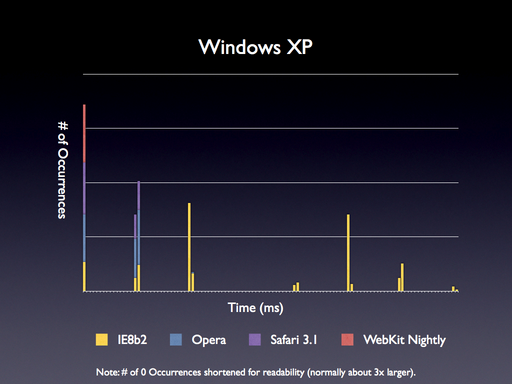
Nope, the results are the same as using the VM.
Let’s think about what this means, for a moment:
- Any test that takes less than 15ms will always round down to 0ms in these browsers. It becomes impossible to determine how much time the tests are taking with consistently zeroed out results.
- The error rate for any test run in these browsers would be huge. If you had a simple test that ran in under 15ms the error rate would be a whopping 50-750%! You would need to have tests running for, at least, 750ms before you could safely reduce the error overhead of the browser to 1%. That’s insane, to say the least.
What test suites are affected by this? Nearly all of the major ones. SunSpider, Dromaeo, and SlickSpeed are all predominantly populated by tests that’ll be dramatically effected by the error rate presented by these browser timers.
I talked about JavaScript Benchmark Quality before and the conclusion that I came to still holds true: The technique of measuring tests used by SunSpider, Dromaeo, and SlickSpeed does not hold. Currently only a variation of the style utilized by Google’s V8 Benchmark will be sufficient in reducing the error (since the tests are only run in aggregate, running for at least 1 second – reducing the error level to less than 1%).
All of this research still left me in a rough place, though. While I now knew why I was getting bad results in Dromaeo I had no solution for getting stable times in Internet Explorer. I did a little digging, tried a couple more solutions, and stumbled across ies4osx. Ies4osx is a copy of Internet Explorer 6 running in Wine, running in X11, on OS X. It works ‘ok’, although I’ve been able to get it crash every so often. Disregarding that, though, it’s stable enough to do testing on.
Running the numbers on it yielded some fascinating results:
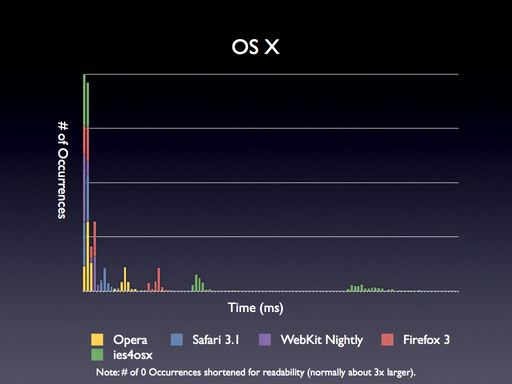
ies4osx provides some surprisingly stable results – we even have something that looks like a normal distribution! This is completely unlike the normal version of IE 6/8 running on Windows. It’s pretty obvious that the Wine layer is tapping into some higher-quality timer mechanism and is providing it to IE – giving us a result that is even more accurate than what the browser normally provides.
This is fantastic and it’s dramatically changed my personal performance testing of Internet Explorer. While I’m not keen on using anything less than “IE running on XP with no VM” for actual testing – this layer of higher-detailed numbers has become invaluable for testing the quality of specific methods or routines in IE.
In Summary: Testing JavaScript performance on Windows XP (Update: and Vista) is a crapshoot, at best. With the system times constantly being rounded down to the last queried time (each about 15ms apart) the quality of performance results is seriously compromised. Dramatically improved performance test suites are going to be needed in order to filter out these impurities, going forward.
Update: I’ve put the raw data up on Google Spreadsheets if you’re interested in seeing the full breakdown.


Elijah Grey (November 12, 2008 at 11:14 pm)
Wow, it’s very surprising seeing how IE6 through Wine is giving you better distributed results. I would of expected just as bad, if not worse deviations from a normal distribution.
Kris Zyp (November 12, 2008 at 11:15 pm)
FWIW, a proposal for high-resolution timers has been discussed in the W3’s public-webapps group:
http://www.nabble.com/Proposal%3A-High-resolution-%28and-otherwise-improved%29-timer-API-td19791635.html
Kris Zyp (November 12, 2008 at 11:20 pm)
AFAICT, the proposal doesn’t address the need for actually getting a precise time though, but they seem related.
John Resig (November 12, 2008 at 11:22 pm)
@Elijah: Yeah, I was quite surprised, as well.
@Kris: Yeah, it seems more related to having highly-accurate timers (not to be confused with high-precision Date/getTime, which is what I’m discussing here). High precision timers would be absolutely wonderful and would solve a number of the problems that I outlined above (although it wouldn’t fix anything for the older browsers, such as IE6).
Mike T. (November 12, 2008 at 11:55 pm)
Wow. Great Article. This sort of blows away a lot of the “X library is faster than Y library” because of Z test results. I’ve always been skeptical of SlickSpeed-like results…especially when reported in comments, threads, etc.
Now it’s time to factor out the XP bias.
Scott Johnson (November 13, 2008 at 12:01 am)
I wonder if Vista has the same issues.
Ernie Bello (November 13, 2008 at 12:06 am)
John, fascinating stuff. I wonder if this problem is limited to XP only. Did you also try Vista?
Thanks for the link to ies4osx by the way. I had no idea that existed.
Rick Strahl (November 13, 2008 at 12:07 am)
High resolution timer APIs are available on Windows – it’s just a matter of browser vendors to actually take advantage of those APIs to retrieve the times more accurtely.
Question is really how critical is this? For testing it can be tricky but you can always run longer/larger tests to route out the timer resolution issues…
John Resig (November 13, 2008 at 12:11 am)
@Scott, Ernie: Unfortunately I don’t have access to Vista. Any additional data there would be greatly appreciated! (Something tells me, though, that we aren’t going to see a major change.)
@Rich Strahl: It appears as if, at least, Firefox and Chrome are taking advantage of these higher resolution timers – at least it isn’t a complete wash.
I consider this to be very critical, especially since so many developers write tests not even realizing that these issues could occur in the first place.
Artur Janc (November 13, 2008 at 12:12 am)
John,
What about the possibility of using Flash to get more accurate timestamps? I remember seeing that JavaScript timers had quite coarse granularity in some Windows-based browsers, something that I haven’t observed in any Flash app, suggesting that Flash uses some different timer mechanism internally.
I’m not sure if it would work for your purposes, but you could potentially call a Flash method to get the current timestamp instead of the JS (new Date).getTime() approach and see if the results are any better. I have no idea about the overhead incurred by such a call, though.
Mr Speaker (November 13, 2008 at 12:17 am)
Do the interval or timeout functions rely on the same internals as date’s getTime()? Are they prone to the same “clumping”?
John Resig (November 13, 2008 at 12:17 am)
@Artur Janc: That’s certainly a possibility. Amusingly, though – how would you measure the overhead of performing those calls without a working time method? I assume you’d be forced to do some intensive level of calls just to get by.
@Mr Speaker: Not exactly. Timers (setTimeout and setInterval) have their own sets of rules which I’ve written about before.
Matt Pennig (November 13, 2008 at 12:23 am)
John,
I went ahead and ran your test page on Safari 3.1, IE7 Firefox 3 and Chrome on Vista (64-bit) and saw the same results. Safari actually had all 400 results end up in the 0ms bucket!
Also, Firefox and Chrome show similar results as in XP; they seem to be using more accurate time APIs.
John Resig (November 13, 2008 at 12:33 am)
@Matt Pennig: Thanks a ton for running those numbers, I really appreciate it. I had seen WebKit nightly hit all 400 within the 0ms bucket but it’s interesting to see regular Safari make it. I imagine that it’s largely dependent upon the speed of the machine, in this case.
Ernie Bello (November 13, 2008 at 12:33 am)
John,
I tested your timer code in IE7 on Vista using Fusion 2.0, and it looks like the same problem comes up. Here’s the raw data I got with a whole bunch of 0’s…
John Resig (November 13, 2008 at 12:36 am)
@Ernie Bello: Thanks for the raw data! Yeah, that’s exactly what I was seeing, as well. Ok, I’m both happy (that my tests seem to be working) and sad (that my code is still affected) to see this continue to propagate to the new version of the operating system.
Jonathan (November 13, 2008 at 12:49 am)
I tested your timer code in the Firefox’s lastest nighties trunk builds in OS X. I get ,206,93,0,1,0,0,0,2,1,0,6,15,62,13,0,0,0,0,0,0,0,0,0,0,0,0,0,0,0,0,0,0,0,0,0,0,0,0,0,1
Rob Arnold (November 13, 2008 at 12:58 am)
I think you would be interested in bug 363258 (https://bugzilla.mozilla.org/show_bug.cgi?id=363258 ). In short, the internal windows clock only updates every 10 (XP Home?) or 15ms which is the interrupt rate for the PIC timer. You can force this to be faster but it eats up to 25% more battery life. Firefox 3 (and apparently Chrome? I should look.) use a more complicated method to overcome this limitation.
dhoon (November 13, 2008 at 1:01 am)
Firefox 3.1b2pre nightly x86-64 build by Makoto on Vista64.
2nd run:
,154,144,2,0,0,0,0,5,25,5,0,0,0,4,27,0,0,0,0,0,13,18,2,0,0,0,0,0,0,0,0,0,0,0,0,0,0,0,0,0,0,0,0,0,0,0,0,0,0,0,0,0,0,0,0,0,0,0,0,0,0,0,0,0,0,0,0,0,0,0,0,0,0,0,0,0,0,0,0,0,0,0,0,0,0,0,0,0,1
Travis (November 13, 2008 at 1:13 am)
Here’s my native Vista x64 SP1 results
,97,20,42,62,36,42,1,0,0,0,0,0,0,0,2,16,53,24,1,1,1,0,0,0,0,1,0,0,0,0,0,0,0,0,0,0,0,0,0,0,0,0,0,1
IE7 x64:
100,0,0,0,0,7,64,24,4,0,0,1,0,0,0,0,0,0,0,0,0,0,0,0,0,0,0,0,0,0,0,0,0,0,0,1,5,3,0,1,25,25,15,11,5,3,1,0,1,0,0,0,0,0,1,0,0,0,0,0,0,1,0,0,0,0,0,0,0,0,0,0,0,0,1,0,0,0,0,0,0,0,0,0,0,0,2,6,12,14,19,11,12,8,5,1,3,2,0,0,2,1,0,0,3
IE7 x86:
,93,7,9,8,0,7,59,14,3,0,0,0,0,0,0,0,0,0,0,0,0,0,0,0,0,0,0,0,0,0,0,0,0,0,0,4,2,1,0,38,29,14,6,1,2,1,0,0,0,0,0,1,0,0,0,0,0,0,0,0,0,0,0,0,0,0,0,0,0,0,0,0,0,0,0,0,0,0,0,1,0,0,0,0,0,0,7,12,11,18,12,14,8,9,2,1,0,2,1,2,0,1
Chrome 0.2.149.30:
,200,22,56,2,14,5,1,1,22,22,22,15,7,2,2,0,0,1,1,1,1,1,0,0,0,0,0,0,0,0,0,0,0,0,0,0,0,0,0,0,0,0,0,1,0,0,0,0,0,0,0,1
Safari 3.1.2:
,105,122,57,14,0,2,6,35,41,7,4,1,1,0,0,0,0,0,1,2,0,0,0,0,0,0,0,0,0,0,0,0,0,0,0,0,0,0,0,0,0,0,0,0,0,0,0,0,0,0,0,0,0,0,0,0,0,0,0,0,0,0,0,0,0,0,0,0,0,0,0,0,0,0,0,0,0,0,0,0,0,0,0,0,0,0,0,0,0,0,0,0,0,0,0,0,0,0,0,0,1,0,0,0,0,0,0,0,0,0,0,0,0,0,0,0,0,0,0,0,0,0,0,0,0,0,0,0,0,0,0,1
Opera 9.52:
,100,47,94,24,24,9,0,23,51,12,6,2,0,0,1,1,0,1,2,0,0,1,2
Paddy Mullen (November 13, 2008 at 2:30 am)
Have you tried finding a slower processor to run the tests on? That might help some with granularity issues. Ideally you could just set the multiplier lower, as in power saving mode of a modern processor. Using an older architecture processor might not be able to take advantage of low level optimizations in current browsers.
Noel Grandin (November 13, 2008 at 2:52 am)
The simplest possible solution is to expose the CPU’s TSC counter to javascript, which would give you high-quality timing results that works on all modern hardware.
(In Java, the API is called System.nanoTime()).
Jerky (November 13, 2008 at 4:03 am)
The reason Windows offers 15-16ms resolution timers and nanosecond resolution timers is because the coarser resolution is much less expensive to query.
Ideally browsers would implement a cross-browser function for getting higher resolution results and still leave you the option of the coarse resolution API for when you don’t need high resolution.
This behavior is also seen in many platforms running on Windows and is not specific to browsers (as it’s specific to the underlying system calls used by the higher level systems/platforms).
Daniel Burke (November 13, 2008 at 4:11 am)
Ask a C programmer about timing in windows… the general word is the win32 system timer is only accurate to about +/- 4ms. It may be better, it may be worse. Under moderate load expect it to get a lot worse. If you’re after seriously accurate timing, the linux kernel can be tuned for it, read about ardour (the linux audiophiles like their crazy real-time accurate stuff)
Bart (November 13, 2008 at 5:07 am)
Look up GetTickCount in Wikipedia. There’s the cause of the low resolution.
Jake Archibald (November 13, 2008 at 5:24 am)
Thinking out loud…
Can anything be embedded into a page that has a higher res timer that javascript can communicate with? Flash / Applet / ActiveX?
I realise that communication with this plugin would have a speed impact, but if the speed impact is constant, that’d be fine for comparison of two pieces of code on the same browser.
Nicolas (November 13, 2008 at 5:29 am)
It might have absolutely nothing to do with this (at least it has to do with the test cases that took less that 15 millisec.), but this kind of makes me think about this experiment:
http://wings.avkids.com/Curriculums/Forces_Motion/pendulum_howto.html
Step nine says:
“To find the period of one swing, divide your time values for 10 swings by 10.”
Philip Taylor (November 13, 2008 at 6:33 am)
Noel: From what I’ve heard, the TSC isn’t a particularly good solution: it measures ticks rather than seconds, and modern CPUs have frequency scaling so their ticks-per-second constantly changes, which makes it pretty useless; and on some multi-processor systems the TSCs on each processor are not synchronised, so you can get different results depending on where your thread is running. The new HPET timer seems to be designed to solve most of the problems, but it’s not available in XP (though it is in Vista). Making high-resolution timers work accurately and reliably across a wide range of (often buggy) hardware seems like quite a pain. (There’s some related discussion here in the context of games.)
Robert Kieffer (November 13, 2008 at 7:16 am)
John, great post and timely too.
As you’ve noted, testing JavaScript requires running your test for 500-1000ms. The JSLitmus Tool addresses exactly this problem by auto-calibrating the iteration loop for a test.
The idea is pretty simple: tests are run in multiple passes, starting with a modest 10x iteration. If that takes longer than 500ms (and it usually does), the next passes uses an iteration count extrapolated from the results of the first. This is repeated until the test takes > 500ms. This typically takes 2-3 passes at most.
Each pass is run by a setTimeout, which allows the browser to garbage collect, re-render the DOM, and clear the “script is taking too long” timer.
Sjoerd Visscher (November 13, 2008 at 7:53 am)
In my experience, time difference are not rounded down. Sometimes when something only takes a few ms you can get a result of 15ms. It just depends if there has been a tick during the test or not. These ticks occur once every 15/16ms.
So if you measure a test that takes around 1ms a 1000 times, and sum the results, you will get an accurate result.
kentaromiura (November 13, 2008 at 8:23 am)
It’s pretty trivial to write a custom browser using .net that uses Stopwatch to calculate the time: example:
benchmark.cs
using System;

using System.Collections.Generic;

using System.Linq;

using System.Text;

using System.Diagnostics;

using System.Runtime.InteropServices;

namespace iespeedtest {

    [System.Runtime.InteropServices.ComVisibleAttribute(true)]

    public class benchmark {

        Stopwatch bench;

        Action<string> ShowBench;

        public benchmark(Action<string> showBench) {

            ShowBench = showBench;

        }

        public void startBench() {

            bench = Stopwatch.StartNew();

            ShowBench(string.Format("Starting TEST at {0}\n",DateTime.Now));

        }

        public void stopBench() {

            bench.Stop();

            ShowBench(string.Format("Stop the test at {0}: {1}\n",DateTime.Now,bench.ElapsedMilliseconds));

        }

    }

}
form1.cs
        private void MyInit() {

            wbTest.ObjectForScripting = new benchmark(txt => {

                txtOutput.Invoke((Action)(() => { txtOutput.Text += txt; }));

            });

        }
where the form have 2 component: a WebBrowser and a richTextBox.
the code for testing:
<html>

<script>

    onload=function(){

        window.external.startBench();

        var final = 0;

        for(var i=0,max=1000;i<max;i++)

        for(var j=0,jmax=1000;j<jmax;j++) final ++;

        document.body.innerHTML += final;

        window.external.stopBench();

}

</script>

<body>

</body>

</html>
just drop the file on the webbrowser and you’ve your better bench ;)
Doug Domeny (November 13, 2008 at 8:41 am)
I’ve noticed the 15ms precision in the time (WinXP). To minimize the problem, I run a test multiple times so the total takes 5-10 seconds and then divide by the number of times to get an average time to run one test.
Arpad Borsos (November 13, 2008 at 8:44 am)
Such a bug was also present in Firefox 2:
https://bugzilla.mozilla.org/show_bug.cgi?id=363258
Luckily, Firefox3 fixed it.
But yes, this is an issue of using the wrong OS timer in Windows. Having the benchmarks run for a certain amount of time (1s) and counting the number of iterations seems to be a good way to deal with this problem. Also, “higher is besser” is a better way to interpret benchmarks.
Brother Erryn (November 13, 2008 at 9:08 am)
Years ago I wrote a short article about precision timing after coming across this problem (http://gpwiki.org/index.php/VB:Timers). It’s like Jerky (et al) said, in Windows the most commonly-used timer is ticked every 15.625ms. There’s a way around that, even with the aforementioned getTickCount API call. The workaround was pretty darned obscure at the time I wrote the article.
Oh, and long-time lurker and consumer, first time poster. :)
Manfre (November 13, 2008 at 9:15 am)
To get an idea of overhead associated with wine, you should install a windows build of firefox 3 so that runs through wine.
Tim McCormack (November 13, 2008 at 9:21 am)
Nice results, but I’m having trouble reading the bar charts. Would you consider switching to alternating (“striped”) bar charts or multi-level charts instead?
Paul Betts (November 13, 2008 at 10:38 am)
If you’re really keen on getting good results in IE, write an ActiveX control that exposes QueryPerformanceCounter (http://msdn.microsoft.com/en-us/library/ms644904.aspx) – QPC’s accuracy is around the 1ms range I believe. If you want even *more* accurate results, set your boot option to limit to one processor, so you don’t have to worry about SMP timer inaccuracy.
Tufte (November 13, 2008 at 11:17 am)
Heh. The axes are labeled with units (ms), but there’s no values for them to be units of. :-)
Boris (November 13, 2008 at 11:55 am)
Actually, the times for a test shouldn’t be normally distributed. They should be a shift of the distribution for the lag introduced (shifted by the time the test “actually” takes).
The thing with lag is that it can’t be normally distributed. Say your lag has a mean of 2ms. If it were normally distributed, then your 5ms lags would occur as often as your -1ms lags. But of course there are no negative lags. It’s worth it to do a bit of thinking about what the lag distribution really looks like, and what the sources of lag are. You mention context switching, but other sources of lag could be cache misses and branch mispredictions, as well as GC in the browser. There are probably others too. Figuring out what the actual distribution of lag is could be a nice Masters thesis, if no one has done it yet. That said, if you’re adding up and averaging to get the times you’re graphing, then by the Central Limit Theorem you’ll do OK by pretending the result is normal.
And of course all of the above assumes that you’re perfectly timing the tests. In practice, you aren’t (not least because of the 1ms accuracy of Date() even in the best case). I suspect your timing effects have more of an impact on the observed distribution than any aspect of the test itself.
Yann Ramin (November 13, 2008 at 12:08 pm)
There is one little trick you can try with Windows. Open Windows Media Player. Now re-run the tests. You don’t have to play anything either, just keep the main window up.
Windows Media Player makes some calls to change scheduling behavior to a much lower latency model in Windows. This trick is commonly used to run game servers on Windows. I don’t think it will help with Window’s 10ms regular timer granularity, but its worth trying anyway.
Markus Kohler (November 13, 2008 at 2:46 pm)
Hi John,
It’s almost always a good idea to calibrate your benchmark to run for a certain amount of time and typically repeat it for a minimum number of times (Unless you want to measure the performance of a “cold” VM).
Even if we would have more accurate hardware based timers, this would be a good idea, because the less often you make a call to the timer function the less you influence your test.
Hardware based timers have usually their own problems, such as for example not being in sync on different cores of a multicore cpu.
Oliver (November 13, 2008 at 3:40 pm)
To those people who suggest using the windows high res timers — Using the windows high res timers in one windows application will effect all other windows applications — eg. any application with a
Kenny S. (November 13, 2008 at 6:54 pm)
While everyone here is talking about the content of this post, no one sees the real problem. That my claims Statistics have no place in a coding curriculum at a college are hugely wrong and unfounded. Nice one, Resig. :) On the bright side, at least I finally know how a normal distribution fits into my unit testing. Looks like I am going to be retaking a certain class.
mdakin (November 13, 2008 at 7:46 pm)
Any action plan to fix Dromeao and Sunspider?
Eduardo Lundgren (November 14, 2008 at 10:37 am)
Good to see performance tests being showed using normal distribution.
thanks.
Erik Harrison (November 14, 2008 at 3:08 pm)
This is not actually the first time I’ve seen an underlying improvement in Wine’s implementation of Win32 bubble up to a browser – last check Safari for Windows passes more of the jQuery test suite when run on Wine than when run on Windows proper.
doon (November 15, 2008 at 12:42 pm)
Isn’t ReactOS based on Wine? Because my results of Firefox 2 running on ReactOS 0.37 in VMWare don’t look so nice:
,269,0,0,0,0,0,0,0,0,0,0,0,0,0,0,34,0,0,0,0,0,0,0,0,0,0,0,0,0,1,63,0,0,0,0,0,0,0,0,0,0,0,0,0,1,31,0,0,0,0,0,0,0,0,0,0,0,0,0,0,0,0,0,0,0,0,0,0,0,0,0,0,0,0,0,1
Dave Johnson (November 15, 2008 at 5:11 pm)
nice results John! I have noticed this in the past as well, however, repeating a single test and averaging the results will approach the same distribution as non-windows tests will it not?
sunnybear (November 16, 2008 at 9:26 am)
It’s normal situation. I’ve been tracking some CSS/JS performance tests for a year and there are a lot of issues with ’rounding’ timer. Safari under Windows also shows close picture.
I think the only solution is to run dozens of tests and take an average. There are couple of math theorems that proving that with enough numbers of tests a statistical error will be small for every kind of distribution (‘big numbers law’).
P.S. John, Paralles has recently lauched new version of their solution for running Windows on Mac with dozens of new features.
Erik Harrison (November 17, 2008 at 12:40 am)
@roon: The timing is of course going to depend on what kind of API the kernel provides. If the timing API is passing through to a high resolution timer from the underlying kernel on OS X doesn’t mean that it does the same thing on the ReactOS kernel.
Ezra (November 17, 2008 at 3:35 pm)
I used browsershots to get screenshots of the results from your little tool. Hope it helps.
https://browsershots.org/http://ejohn.org/files/bugs/timer/
Al (February 20, 2009 at 2:14 am)
Great tests! I have been testing the speed of of my jQuery scripts for about a year now, testing individual querys to make sure I am acessing the DOM as quickly as possible… I came across 0ms a bunch of times too, and also found that anything under 20-30ms was extremely unreliable so this explains a lot!
The tests are also very interesting from a JavaScript animation perspective. If we do the math… 60 fps = 1 frame every 16.666…7 milliseconds. If “on average” the results of the browser time query is reliable to 15ms, and then we add a few ms for margin of error… can we say that accurately limiting a JavaScript animation to 60fps is “wishful thinking”?
Phil (April 16, 2009 at 12:16 pm)
Actually this is an issue with the System timer, i doubt any browser can be any more accurate than the timer libraries built into the OS.
Anthony Alexander (May 25, 2009 at 12:35 am)
All my tests (Windows XP) show variations as well. I use the built in FPS counter in my framework to regulate performance across browsers. Click the link and type ‘V V E D’
The first number is the actual latency, Chrome varies from 0-4 when idle. The one in green is the average FPS for the last n seconds, configurable in realtime, and the last is the actual fps based on the latency. It operates in two modes, this is the cpu heavy one which I recently implemented. I noticed that Chrome in beta was giving me upwards of 500+ fps and went down drastically since the official release. I have factored in my framework almost doubling in size since I initially implemented the statistics, but all the other browsers have maintained their FPS or improved it. IE 6 and Opera 8 ran about 64 fps, but since installing IE8 (I never used 7) it’s gone down by about 33% to 40+%.