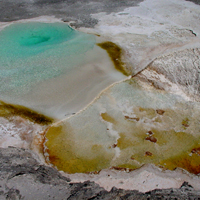

Calculates the histogram of an image. A histogram is the frequency distribution of the gray levels with the number of pure black values displayed on the left and number of pure white values on the right.
Original Processing.org Example: Histogram
// All Examples Written by Casey Reas and Ben Fry
// unless otherwise stated.
size(200, 200);
colorMode(RGB, width);

int[] hist = new int[width];

// Load an image from the data directory
// Load a different image by modifying the comments
PImage a;
a = loadImage("cdi01_g.jpg");
image(a, 0, 0);

// Calculate the histogram
for (int i=0; i<width; i++) {
  for (int j=0; j<height; j++) {
    hist[int(red(get(i, j)))]++;
  }
}

// Find the largest value in the histogram
float maxval = 0;
for (int i=0; i<width; i++) {
  if(hist[i] > maxval) {
    maxval = hist[i];
  }
}

// Normalize the histogram to values between 0 and "height"
for (int i=0; i<width; i++) {
  hist[i] = int(hist[i]/maxval * height);
}

// Draw half of the histogram (skip every second value)
stroke(width);
for (int i=0; i<width; i+=2) {
  line(i, height, i, height-hist[i]);
}